
How to Read Market Probabilities Fast
10 July 2026
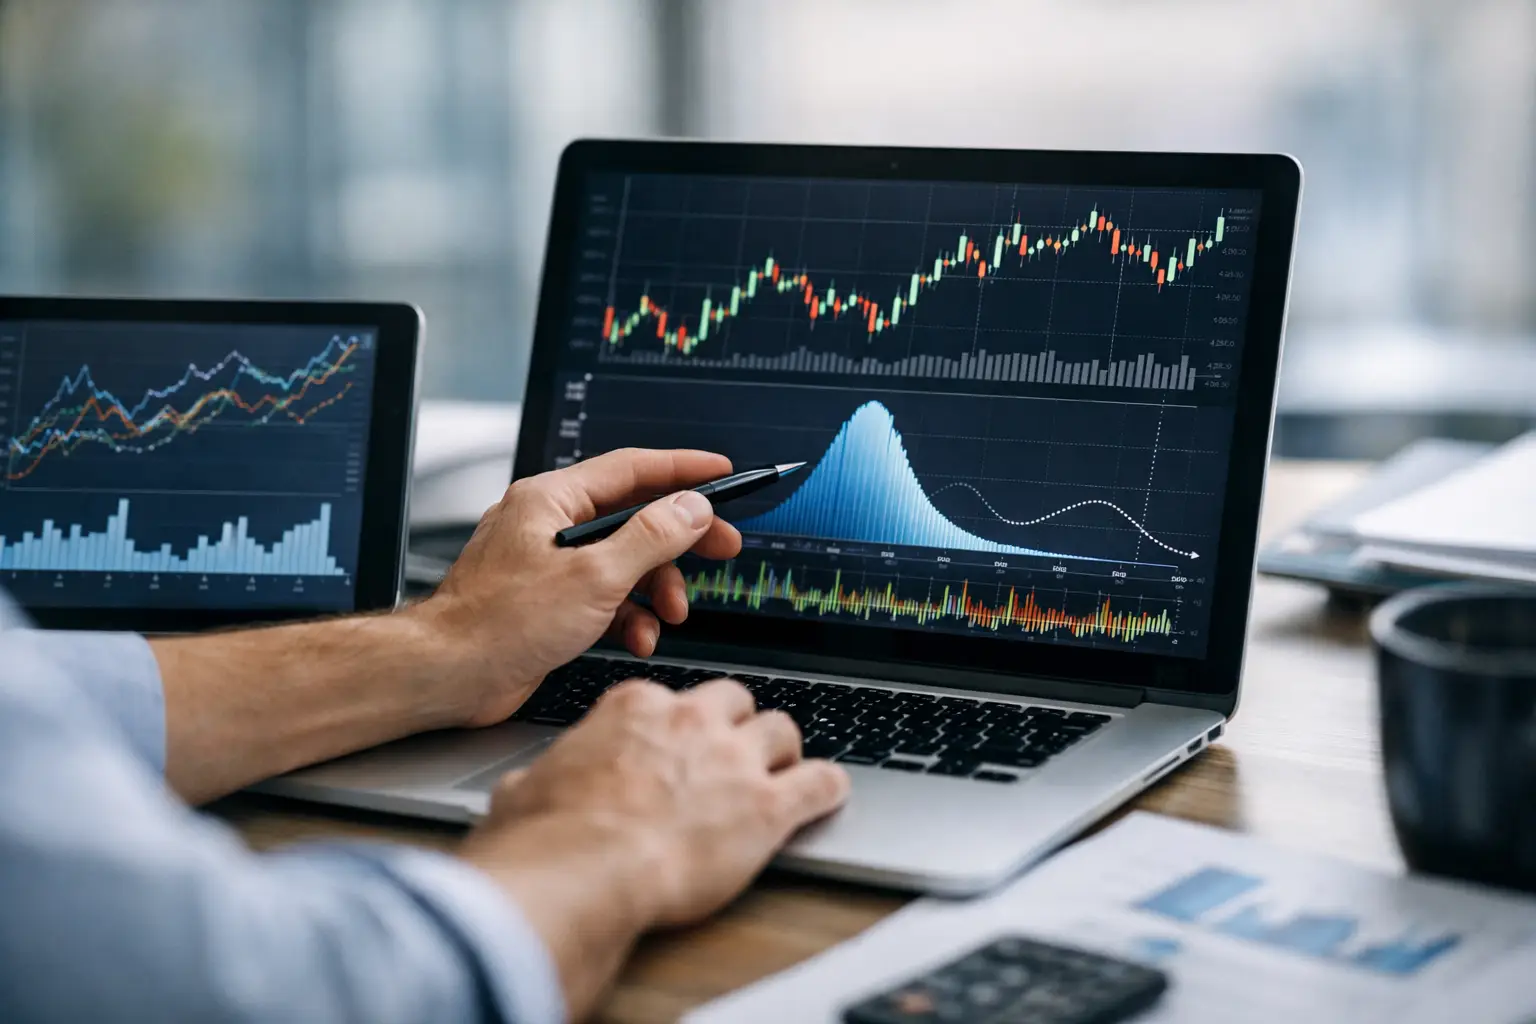
A market at 64% is not telling you what will happen. It is telling you what the crowd, the price, and the available information currently suggest is most likely. That distinction is everything. If you want to learn how to read market probabilities, you need to stop treating them as predictions carved in stone and start reading them as live signals shaped by belief, risk, and new information.
That shift is what separates casual guessing from informed positioning. Strong forecasters do not just ask, “Who wins?” They ask, “What is the market saying, why is it saying it, and is that number fair?”
What market probabilities actually mean
A market probability is the implied chance of an outcome happening, expressed as a percentage. If a market says there is a 70% chance that a film wins a major award, that does not mean the result is certain. It means the current market price reflects that outcome as the most likely among the available options.
This sounds simple, but many people read probabilities emotionally. They see 70% and think “almost guaranteed”. They see 35% and think “no chance”. Neither reading is sharp enough. A 70% probability still fails 3 times in 10. A 35% probability still lands often enough to matter. Prediction is not about certainty. It is about pricing likelihood better than the crowd.
That is why percentages matter so much on a prediction platform. They compress a huge amount of information into one number - public sentiment, breaking news, timing, liquidity, uncertainty, and sometimes overreaction.
How to read market probabilities in real terms
The fastest way to understand a probability is to translate it into frequency. Instead of reading 60% as an abstract number, read it as “roughly 6 times out of 10”. Read 25% as “1 time out of 4”. Read 10% as “1 time out of 10”.
This makes probabilities feel real. It also stops you from overvaluing confidence. If an outcome is priced at 80%, your question should not be “Will it happen?” Your question should be “Is this outcome more likely than 8 times in 10?” That is a much higher standard, and a much better one.
This is where edge begins. You are not trying to be right in a dramatic, all-or-nothing sense. You are trying to decide whether the market has priced the event too high, too low, or about right.
A quick way to frame common probability bands
Probabilities tend to feel different at different levels. Below 20%, you are looking at a genuine outsider - possible, but unlikely. Between 20% and 40%, the market sees a live chance, though not the favourite path. Between 40% and 60%, uncertainty dominates and the market is signalling a close call. Above 60%, the market leans clearly one way, but there is still room for surprise. Above 80%, the market sees a strong favourite, not a lock.
Those ranges are useful, but they are not universal truths. A 65% probability in a volatile tech story may carry more uncertainty than a 65% probability in a tightly scheduled political process. Context always matters.
Prices, percentages, and implied odds
On many prediction platforms, price and probability are closely linked. A contract trading at 0.72 usually implies a 72% chance. A contract at 0.18 implies 18%. The number is doing one core job: turning a market view into a tradable probability.
Your job is not just to read that number. Your job is to understand what has been baked into it. Has the market already absorbed the obvious headline? Is this number reacting to confirmed information, rumour, or momentum? Is there still room for the probability to move, or has the crowd pushed it too far?
Think of probability as the market’s current verdict, not the final truth.
The mistake most people make
Most weak reads come from one bad habit: confusing probability with conviction. Someone loves a team, a candidate, or a product launch narrative, so they assume the market should agree. Then they see 38% and think the market is missing something obvious.
Sometimes it is. Often it is not.
Markets aggregate more than raw opinion. They absorb disagreement. They reflect what informed participants are willing to back at a given price. That makes them smarter than a hot take and more disciplined than fandom. If your instinct says an outcome should be 55% and the market says 38%, that gap is interesting. But it is not proof that you are right. It is an invitation to test your reasoning.
Read the move, not just the number
A probability on its own is useful. A probability that has moved sharply is often more useful.
If a market jumps from 42% to 58%, something changed. That change could be new information, a shift in sentiment, increased participation, or a delayed reaction to something the market had underweighted. Reading market probabilities well means paying attention to direction and speed, not just the latest figure.
A slow grind upwards can signal growing confidence. A violent spike can signal fresh news or crowd panic. A sharp reversal can tell you the first move was overstated. None of these patterns guarantees anything, but they help you read whether the market is settling into a stronger consensus or thrashing around in uncertainty.
This is where discipline matters. Fast movement feels exciting, but not every move is insight. Sometimes it is noise wearing the clothes of urgency.
Context changes the quality of a probability
Not all 60% readings are created equal. The same number can mean different things depending on the market.
In a high-attention event with constant updates, probabilities often adjust quickly because information gets absorbed fast. In a niche culture market or a less-followed global event, prices may lag because fewer participants are pushing the number towards efficiency. That can create opportunity, but it also creates risk. Thin markets can look decisive when they are actually fragile.
Timing matters too. Early probabilities are often wider reflections of narrative and expectation. Late probabilities tend to be tighter because more information is known. Neither is automatically better. Early markets may offer more mispricing. Late markets may offer more clarity. It depends on whether you are stronger at spotting what the crowd has missed or at interpreting confirmed developments better than everyone else.
How to tell if a probability looks too high or too low
This is the core skill. To judge a market probability, start by asking what would have to be true for the number to make sense.
If a market shows 75%, what assumptions are embedded in that price? Is the crowd assuming no further bad news, a clean execution path, or a level of public support that may not hold? If the market is at 28%, what is it dismissing? A comeback path, a timing advantage, a narrative shift, or a catalyst that is not yet mainstream?
Then compare your own estimate. Not your hope, your estimate. If you believe the true chance is 40% and the market is at 28%, that gap may be value. If you think the true chance is 60% and the market is at 75%, the favourite may be overpriced even if it still wins.
That is the mindset serious predictors use. They are not chasing certainty. They are hunting bad prices.
Beware of false precision
A market at 51% can look scientific. It is still an estimate.
Probability numbers feel clean, but the world is messy. Some events are easier to quantify than others. A scheduled vote with clear whip counts is not the same as a celebrity scandal, a product rumour, or a fast-moving geopolitical event. The more ambiguous the inputs, the more cautious you should be about reading tiny percentage differences as meaningful.
This is why the best users stay flexible. They have conviction, but they do not marry a number. They update when the facts change. They recognise when the market has become smarter than their original read.
Build a sharper read over time
If you want to improve at reading probabilities, track your own judgement against market outcomes. Estimate first, then compare. Write down why you disagreed with the market. Later, review what actually moved the result.
You will start to notice patterns. Maybe you overrate momentum and underrate institutional factors. Maybe you get entertainment markets right but struggle with macro themes. Maybe you react too strongly to headlines that the market had already priced in. That kind of self-audit is not glamorous, but it builds real edge.
Platforms like Versus make this process more visible because prediction is not just participation - it is a record of judgement. Over time, your probability reads become part of your reputation.
How to read market probabilities without overthinking them
You do not need a finance degree to read a market well. You need a clean framework. Read the percentage as a frequency. Ask what assumptions sit behind it. Check whether the move is new information or noise. Compare the market’s view with your own estimate. Stay humble about uncertainty.
That is the game. Not guessing louder. Seeing clearer.
The best forecasters are not hypnotised by prices. They interrogate them. They know every percentage is a live argument about the future, and the sharpest position often starts with a simple question: does this number actually deserve to be here?
Keep asking that, and your reads get smarter.
Predict the world’s next moves.
enter versus™